|
|
|
|
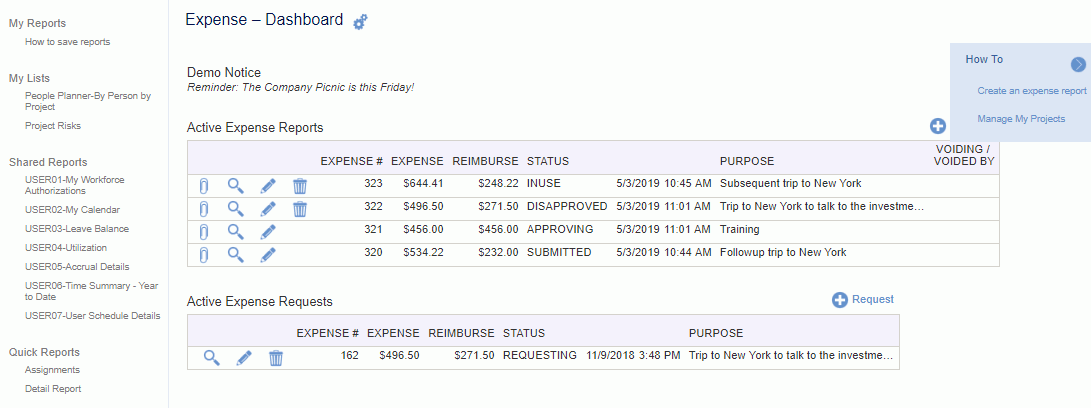
The Expense Dashboard provides a number of navigational links, summary information, helpful tips and more. The various sections and options that may appear are associated with each user's roles. This Dashboard is available to users having an Expense User role (and their alternates). Below is an example dashboard screen with a description of the various items that may be included.
This dashboard is available to users having the Expense User role (and their alternates). The sections and options that appear depend on which roles a user has.
This dashboard is available with any of the following Unanet licenses: Project Expense, Project Tracking, Project Portfolio, Project Tracking Financials and Project Portfolio Financials.
Topics covered on this help page include:
SubMenu Items (on the main menu)
You may also be interested in:

Note: If the Enable Expense Request Functionality (unasense.request.enable) property is set to false, the Expense Requests widgets and ![]() icon will not display.
icon will not display.
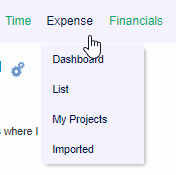
Depending on each user's roles, the following submenu items may be available under the Expense main menu item:

List -- Selecting this menu option will present the user with a list of their Active and Historical expense reports.
My Projects -- Can be used to manage which Projects/Task will show up on the user's timesheet or expense report.
Imported -- Can be used to view a list of Credit Card transactions that have been imported for your credit card account.
If you have a certain report that you run on a frequent basis with the same or similar selection criteria, you can save and reuse that criteria. Once you save a report or create an ad-hoc report, you can control which saved reports and/or ad-hoc reports will appear in your My Reports section so that you can quickly run the report directly from your dashboard (without having to supply selection criteria).

Check out Saving Report Criteria and Adhoc Reporting for more information regarding those topics.
Similar to the concept of My Reports, Administrators can define saved reports and make them available for others to run.

Administrators can check out Sharing Reports for more information.
Similar to the concept of My Reports, users can define saved selection criteria for various lists for one click running (such as lists of people, list of projects, and even Project Notes selection criteria).

The Quick Reports section will contain additional built-in reports that can be launched directly (bypassing the selection criteria screens). These reports may include:

Users can run their own version of these reports with their own custom selection criteria (via the Reports menu option). Depending on the report, a pre-defined date range is automatically supplied with these versions.
To view what criteria is automatically being supplied, simply run the quick report and then click on the Back to Criteria button. This will present you with the selection criteria screen populated with the appropriate entries. Users cannot change the built-in selection criteria options, but if you did want to change the report, you can always save your own criteria using the Saved report feature.

Clicking on the  link on the dashboard title bar, will navigate you to the Preferences >> Dashboard (Dashboard tab) page where you can configure many of the sections on your dashboard, including which reports and lists will appear in your left menu column, which items and in which order various controls will appear in the center section of your dashboards, etc.
![]()
![]()
The add expense report and add expense request icons are available on a number of screens, including the expense dashboard. User's with the appropriate permissions can click on these icons to initiate the creation of a new expense report or request.
Note: If the Enable Expense Request Functionality (unasense.request.enable) property is set to false, the Expense Requests widgets and ![]() icon will not display.
icon will not display.
Click on the  icon on the right-hand side of the screen to expand the How To, Tips, and Custom Links menus.
This section of the dashboard will contain links to additional instructions. The tips displayed will vary depending on the user's role.
Administrators can control which links and sections appear on the dashboards.